One Tool Every City That Is Vulnerable to Climate Change Should Have
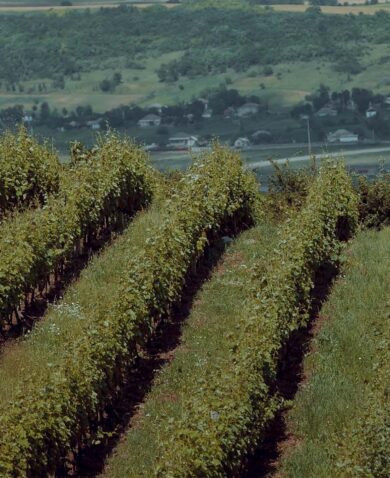
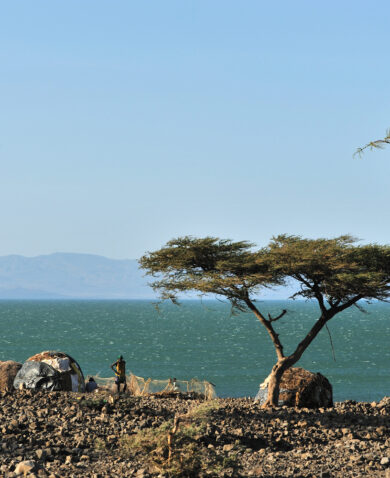
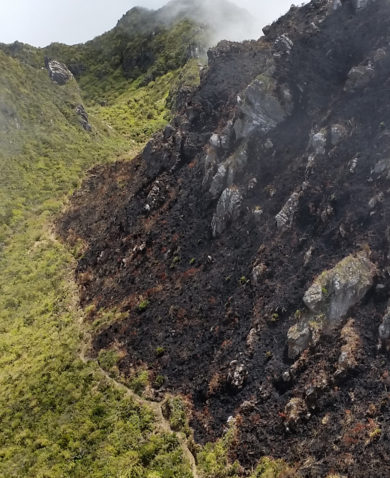
December 8, 2015 | 4 Minute ReadAccording to Lee Gerston, vulnerability maps (such as those pictured here) can help cities understand their unique vulnerabilities and get smarter about climate change adaptation.
Before COP 21 kicked off in Paris, heads of state from 20 countries who make up the Climate Vulnerable Forum adopted the Manila-Paris Declaration, which outlined concerns, priorities and plans for addressing climate change. The declaration enumerated how the threats we see in the news everyday — rising sea levels, cyclones, drought, and others — make these nations vulnerable to climate change.
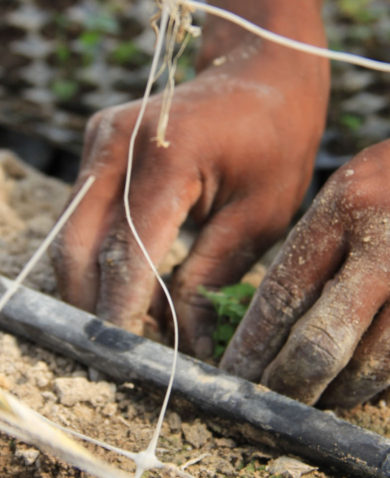
While geography influences how vulnerable nations, cities, and villages are to climate change, non-geographical realities also affect a community’s vulnerability. In a seaside village, for example, the construction methods used for housing, the types of places offering protection from cyclones, and ease of access to health care facilities all impact residents’ vulnerability to the effects of climate change.
Cities and villages around the world need to look at vulnerability from every angle. One tool that can help cities to better understand their vulnerabilities and devise more appropriate, data-driven climate change adaptation strategies is vulnerability mapping.
 What is vulnerability mapping?
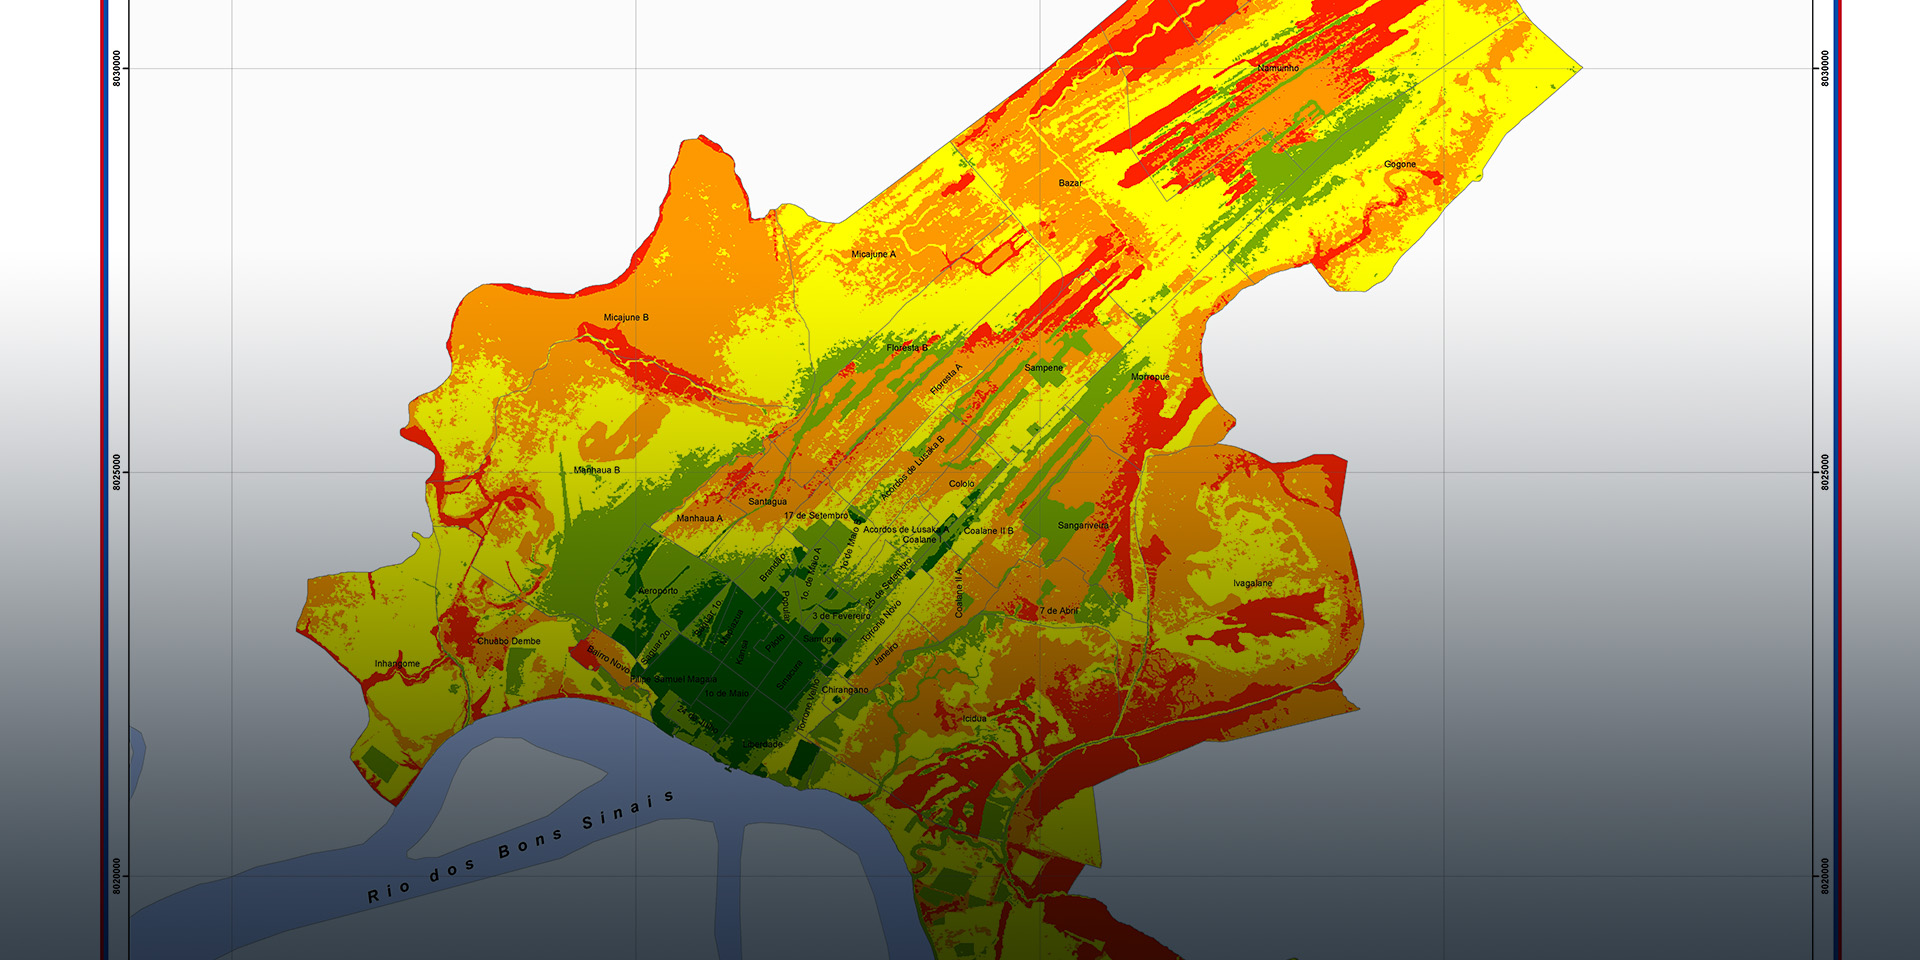
A vulnerability map shows the areas of a city or village that are at greatest risk due to extreme weather events, while taking into account other variables that contribute to vulnerability such as topography, infrastructure, and population density. The maps are usually developed with a computerized geographic information system, such as ArcGIS, by merging existing municipal maps and local data on specific vulnerability variables. As spatial representations of geographical and non-geographical data, vulnerability maps make it easier for cities to understand, communicate about, and adapt to their unique climate change vulnerabilities.
Creating vulnerability maps in Mozambique
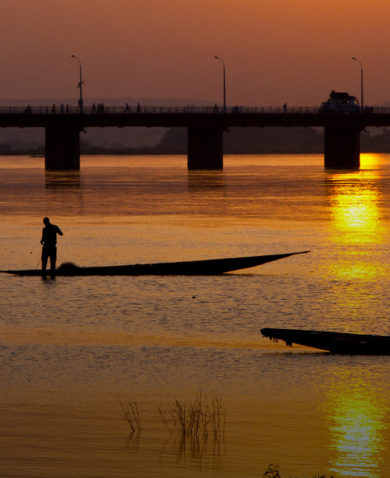
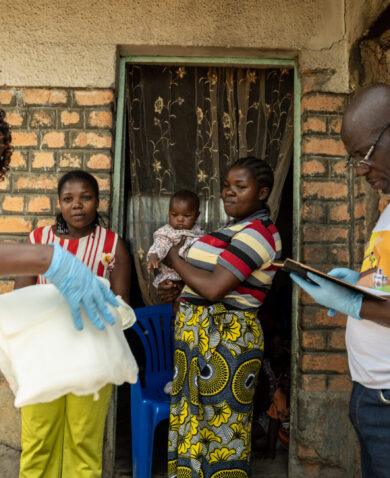
Mozambique is among the most vulnerable countries in the world to the effects of climate change, with 60 percent of its population living in coastal cities. Local governments have long known which cities and villages are most vulnerable by geography, such as those along flood-prone riverbanks and coasts that experience cyclones. But until recently, they had not grasped the other ways in which their communities were vulnerable.
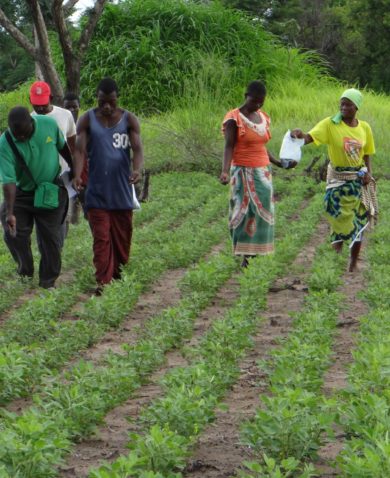
Over the past year and a half, under the USAID’s Coastal City Adaptation Project in Mozambique, Chemonics has been working with officials in Pemba, a coastal city of more than 140,000 residents, and Quelimane, a city of roughly 200,000 along a river, to create vulnerability maps. A look at what these cities are accomplishing with their maps shows at least three reasons why other cities should follow in their footsteps.
Better understanding of climate change vulnerability
To create their vulnerability maps, Pemba and Quelimane used existing satellite and topographic data to develop three map layers:
- Exposure maps show the cities’ geographic vulnerability to the effects of climate change, highlighting the topographical and physical attributes with the greatest risks.
- Sensitivity maps show socioeconomic data with a focus on infrastructure and human settlements that would be impacted by climate events.
- Adaptation maps show the natural- and human-made systems that each city plans to offer to reduce the impact of the climate-related events.
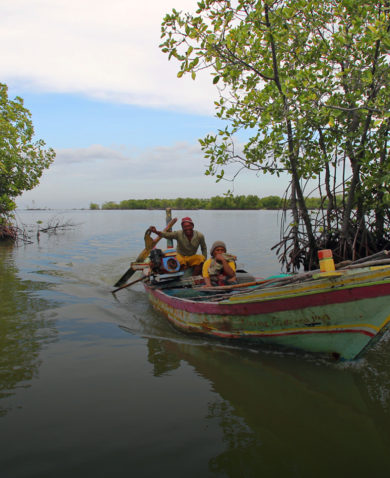
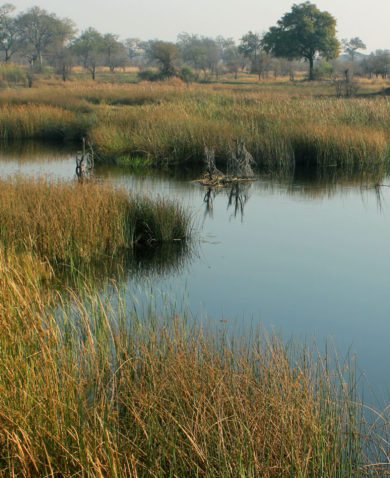
Once merged, these layers provided Pemba and Quelimane with a more comprehensive and contextual understanding of where, why, and how their municipalities are at risk. The cities are already using this data to inform decisions about how to adapt to climate change. For example, Quelimane recently used vulnerability maps to determine where to invest in mangrove restoration.
Improved ability to inform residents about smart land usage
While vulnerability maps are useful for identifying high-risk areas, their power increases when they are integrated with other data that cities collect. Pemba’s local government integrated its vulnerability maps with its municipal cadaster (real estate register). Now that city officials are able to see which homes and buildings are most susceptible to climate change, they are in a better position to manage residents’ and businesses’ land usage.
For now, the municipal governments lack the capacity to enforce land usage restrictions. Until they build the capacity to enforce land usage, municipal officials can take other actions that contribute to adaptation. For example, they can easily determine whether a given residence has a high, medium, or low level of vulnerability and inform their constituents on their level of vulnerability. Telling residents that they are highly vulnerable may be enough incentive them to relocate to a safer area.
As the city’s capacity and credibility increases, it can start advising prospective residents and businesses on where to build, and inform current residents and businesses about relocation options. Ultimately, the municipalities can use vulnerability map to enforce rules and restrictions on building in risky areas.
A versatile tool with many applications
Once vulnerability maps are created, there is no limit to how cities can use them.
While a city like Pemba may incorporate its maps with its cadaster, another may choose to use the maps to determine where to invest resources. Cities can also factor vulnerability maps into the design of detailed infrastructure plans. They can even use them as the basis for imposing higher tax rates intended to dissuade people from building in highly vulnerable areas and adding money to government coffers if residents do decide to build in such places.
The possibilities are endless, which is why this tool is so promising for unlocking the potential of smart cities around the world.