Days of Data: Step-by-Step Guide .
Toolkit | December 30, 2018

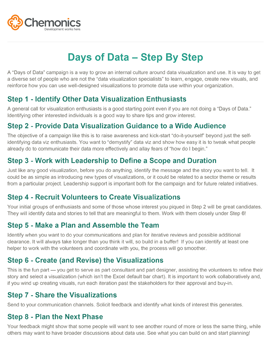
This guide shows how your organization can celebrate data by building a culture around it.
In 2018, our Monitoring, Evaluation, and Learning Team developed and launched a “Days of Data” campaign where we solicited input from people around the company who had expressed interest in data visualization. We worked with them to identify a message and an appropriate visual. We then built the visualization with them. Once ready, we made the visual part of a daily internal email campaign to highlight projects and support functions in the organization that are not usually seen. As a result, we brought awareness to different kinds of visualizations (e.g., dot plot, scatter plot, choropleth map) and built staff capacity to tell a story with data. Learn more through this blog post.
- Toolkit Days of Data: Step-by-Step Guide
